Introduction
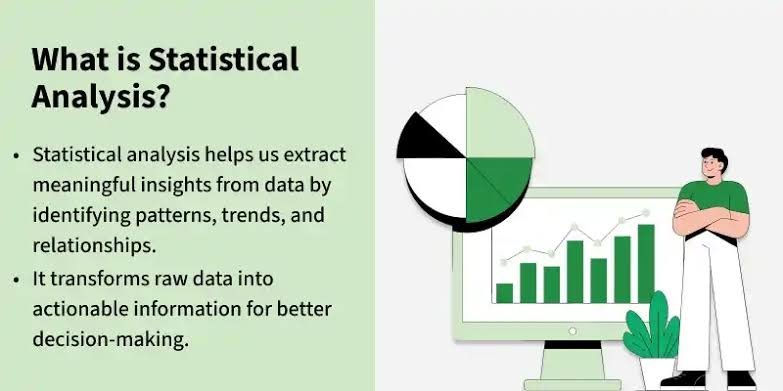
Statistical analysis is an important method for understanding information and identifying meaningful patterns in data. It helps individuals and organizations make informed decisions based on facts rather than assumptions. This process involves collecting, organizing, examining, and interpreting numerical information. Statistical analysis is widely used in education, healthcare, business, science, and research. By applying suitable statistical techniques, researchers can discover trends and draw meaningful conclusions.
1. What Is Statistical Analysis?
Statistical analysis is the process of examining data to understand its meaning and identify useful insights. It allows researchers to convert raw information into organized results that are easier to interpret. Through different statistical methods, people can explore relationships, compare results, and identify patterns. For example, a school may analyze students’ examination scores to understand their academic performance. This approach provides a clearer picture of the available information and supports evidence-based decisions.
2. Importance of Statistical Analysis
Statistical analysis plays a valuable role in solving problems and improving decision-making. It helps people understand complex information by presenting it in a structured and meaningful way. Businesses can use statistical results to understand customer preferences, while researchers can evaluate the outcomes of their studies. It also helps identify possible risks, measure progress, and assess whether particular strategies are working effectively. When data is analyzed carefully, decisions can become more reliable and practical.
3. Data Collection in Statistical Analysis
Data collection is one of the first steps in statistical analysis because the quality of the results depends heavily on the information gathered. Data may be collected through surveys, interviews, questionnaires, experiments, observations, or existing records. Researchers should choose methods that match their objectives and ensure that the information is relevant to the topic. Accurate data collection reduces errors and improves the usefulness of the analysis. Careful planning at this stage helps create a strong foundation for the entire research process.
4. Types of Statistical Analysis
Statistical analysis generally includes descriptive and inferential methods. Descriptive statistics summarize collected information through averages, percentages, tables, charts, and measures of variation. Inferential statistics use information from a sample to make estimates or draw conclusions about a larger population. Other approaches, such as regression analysis and correlation analysis, help researchers examine relationships between variables. Selecting the appropriate method depends on the research question, data type, and purpose of the investigation.
5. Descriptive Statistical Analysis
Descriptive statistical analysis helps explain the main characteristics of a dataset without making conclusions beyond the information being summarized. Common techniques include calculating the mean, median, mode, range, and standard deviation. These measurements help researchers understand typical values and differences within the data. For example, a company can calculate the average monthly sales of its products to evaluate its business performance. Presenting these results through tables and graphs makes the information easier to understand.
6. Inferential Statistical Analysis
Inferential statistical analysis allows researchers to draw conclusions about a larger group by examining a smaller sample. It is particularly useful when studying an entire population would require too much time, money, or effort. Techniques such as hypothesis testing, confidence intervals, and statistical estimation help researchers evaluate their findings. For instance, a survey of selected customers may provide an estimate of the satisfaction level of a company’s wider customer base. However, conclusions should account for sampling errors and uncertainty.
7. Statistical Analysis in Research
Statistical analysis is an essential part of many research projects because it helps researchers examine evidence systematically. It can be used to test hypotheses, compare groups, measure relationships, and evaluate research questions. In academic studies, statistical methods help organize experimental results and determine whether observed differences may be meaningful. Researchers must select suitable techniques and explain their methods clearly so that others can assess the findings. Proper analysis strengthens the credibility and transparency of research.
8. Statistical Analysis in Business
Businesses use statistical analysis to understand markets, evaluate performance, and plan future activities. Sales figures, customer feedback, website traffic, and financial records can all provide valuable information when analyzed correctly. For example, a retailer may examine past sales to identify popular products and anticipate seasonal demand. Managers can also use statistical findings to compare marketing campaigns and improve resource allocation. These insights support more informed planning, although business decisions should also consider practical experience and changing market conditions.
9. Statistical Analysis in Healthcare
In healthcare, statistical analysis helps professionals understand patient outcomes, evaluate treatments, and study patterns of disease. Researchers may compare the results of different treatments to assess their effectiveness and potential risks. Public health organizations can also analyze health records to identify trends and plan preventive programs. Reliable statistical methods help distinguish meaningful patterns from random variation. Nevertheless, medical findings must be interpreted carefully, considering study design, patient characteristics, and other relevant evidence.
10. Tools Used for Statistical Analysis
Several software tools make statistical analysis easier, faster, and more efficient. Microsoft Excel is useful for basic calculations, tables, charts, and simple summaries. SPSS is commonly used for social science research, while R and Python support advanced statistical calculations and data visualization. Specialized software can also help researchers manage large datasets and perform complex analyses. The best tool depends on the user’s experience, the size of the dataset, the required techniques, and the available resources.
11. Challenges in Statistical Analysis
Despite its benefits, statistical analysis can present several challenges. Incomplete data, inaccurate measurements, small samples, and biased collection methods may lead to misleading results. Choosing an unsuitable statistical technique can also produce incorrect interpretations. Another common difficulty is confusing a relationship between two variables with proof that one causes the other. Researchers can reduce these problems by checking data quality, selecting appropriate methods, documenting their procedures, and explaining the limitations of their findings.
12. Best Practices for Effective Statistical Analysis
Effective statistical analysis begins with a clear research question and a suitable plan for collecting information. Researchers should clean their datasets, identify missing values, and check for unusual observations before performing calculations. They should select methods that fit the data and explain results using understandable language, relevant measurements, and appropriate visualizations. It is also important to report uncertainty and acknowledge any limitations. Following these practices makes statistical findings more transparent, useful, and easier for others to evaluate.
Conclusion
Statistical analysis helps transform raw data into meaningful information that supports better decisions. It is useful in research, education, healthcare, business, and many other professional fields. Choosing appropriate methods and collecting reliable data are essential for accurate results. Researchers should also recognize the limitations of statistical findings and avoid unsupported conclusions. Overall, statistical analysis remains a valuable tool for understanding information and solving real-world problems.
Frequently Asked Questions (FAQs)
1. What is the main purpose of statistical analysis?
The main purpose of statistical analysis is to organize, examine, and interpret data to identify patterns, understand relationships, and support informed decisions. It helps people draw conclusions from evidence rather than relying entirely on assumptions.
2. What are the two main types of statistical analysis?
The two main types are descriptive statistics and inferential statistics. Descriptive statistics summarize the characteristics of available data, while inferential statistics use sample information to estimate or draw conclusions about a larger population.
3. Which tools are commonly used for statistical analysis?
Common tools include Microsoft Excel, SPSS, R, and Python. Excel is suitable for basic analysis, while SPSS, R, and Python offer additional capabilities for more complex statistical calculations, research, and data visualization.