Introduction
Data analysis has become an essential part of modern life because organizations generate large amounts of information every day. It helps people understand facts, identify patterns, and make informed decisions. From small businesses to large companies, data analysis supports better planning and problem-solving. It transforms raw information into meaningful insights that can guide future actions. Understanding data analysis is valuable for students, professionals, researchers, and business owners.
1. What Is Data Analysis?
Data analysis is the process of collecting, organizing, examining, and interpreting information to discover useful insights. It allows individuals and organizations to understand what their data represents. Instead of relying on assumptions, people can use evidence to make more reliable decisions. Data analysis can involve numbers, written feedback, survey responses, and other forms of information. Its main purpose is to turn unorganized data into knowledge that can solve problems and support practical goals.
2. Importance of Data Analysis
Data analysis plays an important role in improving the quality of decisions across different industries. Businesses use it to understand customer preferences, monitor performance, and identify opportunities for growth. Educational institutions can evaluate student progress, while healthcare organizations can study trends in patient care. It also helps identify mistakes, reduce unnecessary expenses, and improve the use of available resources. By understanding information more clearly, organizations can make thoughtful decisions and prepare for future challenges.
3. Types of Data Analysis
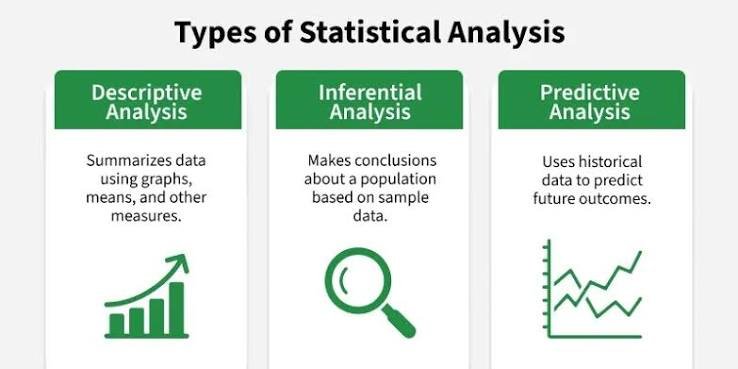
There are several types of data analysis, and each serves a different purpose. Descriptive analysis explains what has happened by summarizing historical information. Diagnostic analysis explores why a particular event or result occurred. Predictive analysis uses historical data and statistical techniques to estimate possible future outcomes. Prescriptive analysis recommends actions that may help achieve a desired result. These approaches can be used separately or together, depending on the problem being investigated and the objectives of the analysis.
4. Data Collection Methods
Data collection is an important first step in the data analysis process. Information can be gathered through surveys, interviews, questionnaires, observations, experiments, and digital systems. Some organizations use existing reports, databases, and public datasets to obtain relevant information. The collection method depends on the research question, available resources, and type of data required. Accurate collection is essential because incomplete or unreliable information can lead to misleading conclusions. Researchers should also respect privacy and obtain consent when necessary.
5. Data Cleaning and Preparation
Before analyzing information, it is necessary to check its quality and consistency. Data cleaning involves identifying missing values, removing unnecessary duplicates, correcting errors, and addressing inconsistent formats. Preparation may also include combining information from different sources and arranging it into a suitable structure. This stage can require considerable time, but it improves the reliability of the final results. When data is properly prepared, analysts can focus on finding meaningful patterns instead of dealing with avoidable problems.
6. Common Data Analysis Tools
Different tools help analysts organize, process, and understand information efficiently. Microsoft Excel is useful for calculations, tables, charts, and basic statistical analysis. SQL helps users retrieve and manage information stored in databases. Python and R provide advanced capabilities for statistical computing, automation, and data modeling. Visualization platforms such as Power BI and Tableau help present findings through interactive reports and dashboards. The best tool depends on the size of the dataset, the complexity of the task, and the user’s experience.
7. The Role of Statistics in Data Analysis
Statistics provides important methods for understanding and interpreting data. Measures such as averages, percentages, medians, and standard deviations help summarize information. Statistical techniques can also be used to compare groups, investigate relationships, and evaluate whether observed differences may be meaningful. These methods help analysts distinguish general patterns from random variation. However, statistical results must be interpreted carefully because a numerical relationship does not automatically prove that one factor causes another. Context is essential when drawing conclusions.
8. Data Visualization and Reporting
Data visualization presents information through charts, graphs, maps, and dashboards. It makes complex findings easier to understand and allows readers to recognize trends quickly. For example, a line chart can show changes over time, while a bar chart can compare different categories. Clear reporting explains what the results mean and why they matter. Effective visualizations should use accurate labels, suitable scales, and simple designs. Good presentation helps decision-makers understand the evidence without becoming overwhelmed by unnecessary details.
9. Applications of Data Analysis in Business
Businesses use data analysis to improve operations, understand market conditions, and evaluate financial performance. Sales records can reveal which products attract the most customers, while customer feedback can highlight areas that need improvement. Companies can also examine inventory levels, advertising performance, and purchasing behavior. These insights support better budgeting, marketing strategies, and resource allocation. When used responsibly, data analysis helps businesses respond to changing customer needs and identify opportunities that might otherwise remain unnoticed.
10. Data Analysis in Healthcare and Education
Data analysis supports improvements in healthcare and education by helping professionals understand important trends. Healthcare providers can examine patient records, treatment outcomes, and service demand to support planning and quality improvement. In education, teachers and administrators can review attendance, assessment results, and student feedback to identify learning needs. Such information can help institutions develop more effective support systems. Nevertheless, sensitive information must be handled carefully, and analytical findings should support professional judgment rather than replace it.
11. Challenges in Data Analysis
Although data analysis offers many benefits, the process can involve several difficulties. Poor data quality, limited technical skills, incompatible systems, and insufficient resources can affect the accuracy of results. Privacy concerns and cybersecurity risks also require serious attention. Another challenge is interpreting information without allowing personal assumptions to influence conclusions. Analysts must check their methods, consider limitations, and explain uncertainty when presenting findings. Addressing these issues helps organizations build trust in their results and use information more effectively.
12. Future of Data Analysis
The future of data analysis is closely connected to artificial intelligence, automation, and the growing availability of digital information. Modern tools can process large datasets more quickly and help identify patterns that may be difficult to notice manually. Machine learning can support forecasting, classification, and other analytical tasks. At the same time, human judgment remains important for checking results, understanding context, and making ethical decisions. People who develop analytical thinking, communication, and technical skills will be better prepared to work with data in an increasingly digital world.
Conclusion
Data analysis transforms raw information into useful knowledge that supports better decisions. It helps individuals and organizations identify patterns, evaluate performance, and solve practical problems. Its applications extend across business, healthcare, education, research, and many other fields. However, accurate results depend on reliable data, appropriate methods, and responsible interpretation. By learning the fundamentals of data analysis, people can develop valuable skills and make more informed decisions in their personal and professional lives.
Frequently Asked Questions (FAQs)
1. What is data analysis in simple words?
Data analysis means examining information to understand what it shows. It helps people discover patterns, answer questions, and make decisions based on evidence rather than guesses.
2. Which tools are commonly used for data analysis?
Common tools include Microsoft Excel, SQL, Python, R, Power BI, and Tableau. Beginners often start with Excel before learning more advanced programming and visualization tools.
3. Is data analysis a good career choice?
Data analysis can be a promising career for people who enjoy problem-solving, working with information, and finding patterns. Learning statistics, spreadsheets, databases, visualization, and communication skills can help prepare someone for this field.